· Serhii Siryk · Backend Development · 6 min read
Debugging Node.js backend with Typescript and IntelliJ

Introduction
Couple of weeks ago we’ve migrated one of our Node.js backend projects from Babel to Typescript. The reason was mostly because it gives us a much-needed type-safe option for backend development using Express. Besides, we’ve been actively using Typescript with Angular and React and we really like all the benefits it brought in our lives. However it took us some time to get things working with typescript again, especially to configure our project and IDE so that we could debug both application logic and tests right from IDE. In this short tutorial we’ll show how you can debug your Node.js backend written with Typescript using Intellij Idea.
🖐️ Hey! Want to be a rock star NodeJS Developer?
Write a catching NodeJS Developer resume using SweetCV – an amazing
online CV builder
. Ready to conquer the world? 👇
Build Your CV NowNote, that in this material you won’t find any steps to bootstrap your application with Express/Typescript. There’re a lot of tutorials over the internet showing how to do that. We’ll just look at small part of this process, and namely debugging, which is usually not really covered in tutorials mentioned above. Of course, you might even go without any IDE-based debuggers and build cool things with NodeJs and Typescript, however sometimes it’s very useful if you can put some breakpoints and dig into your running code in your IDE.
Now we can get started!
Unit Tests Debugging
First and easiest thing to debug is unit tests. Here’s the typical controller logic you might want to unit-test:
self.approveUser = async (req, res, next) => {
  req.customer.approve(req.user);
  let updatedCustomer = await req.customer.save();
  res.json(updatedCustomer);
};
And here’s simple unit-test (Mocha, Sinon):
describe("approveUser", () => {
    it("approve customer passing current user", () => {
        //arrange
        let customer = {approve: sinon.stub(), save: sinon.stub()};
        let req: any = {user: 'me', customer: customer},
            res: any = {json: sinon.stub()},
            next = sinon.stub();

        //act
        sut.approveUser(req, res, next);

        //assert
        req.customer.approve.calledWith(req.user);
    });
});
Lets say we want to set one breakpoint in the test and one in the method itself. Like this:
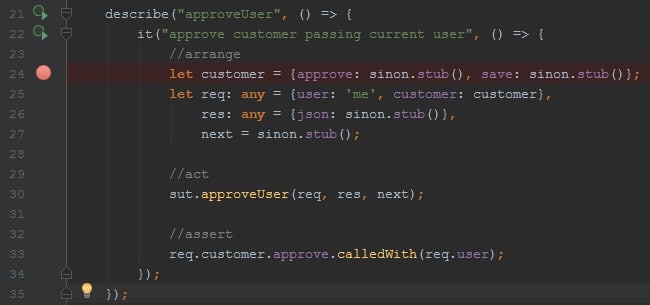

As you’ve probably noticed on the second image, IntellijIdea have recognized the test and placed special icons ![]() that can be used to execute either single test or the whole spec at once. Clicking on any of the icons will display menu where you can select what do you want to do: Run or Debug. Clicking on debug will execute the test and IDE will instantly stop on the first breakpoint.
that can be used to execute either single test or the whole spec at once. Clicking on any of the icons will display menu where you can select what do you want to do: Run or Debug. Clicking on debug will execute the test and IDE will instantly stop on the first breakpoint.
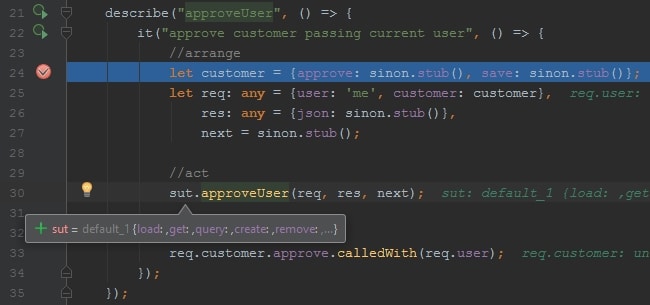
First of all, we can see that typescript code wasn’t transpiled, which is great as we want to see original code while debugging. Under the hood IntellijIdea uses ts-node, so that typescript code is transpiled on the fly. Here’s the command IntellijIdea uses to execute debugging session with mocha passing:
--require ts-node/register
"C:\Program Files\nodejs\node.exe" --inspect-brk=58345 C:\Git\debug-
ts\node_modules\mocha\bin_mocha --require ts-node/register --timeout 0 --ui bdd --reporter
C:\Users\me\.IntelliJIdea2017.2\config\plugins\NodeJS\js\mocha-
intellij\lib\mochaIntellijReporter.js C:\Git\debug-
ts\server\test\unit\users\usersCtrl.unit.ts --grep "UNIT\: users\.ctrl approveUser approve
customer passing current user$"
Most of the parameters passed here are basically mocha params. But actually, you don’t event need to understand anything of that magic, unless you need some custom configuration.
Integration Tests Debugging
Assuming we have our web API running on localhost:3333, we might want to test it with integration tests. Let’s see how typical integration test looks like for the controller method self.approveUser mentioned above.
it.only('should respond with updated user', async () => {
  //arrange
  let account = await dataHelpers.newRegisteredUser().save();
  let testUser = await dataHelpers.newUser().save();

  //act
  let response = await REST.users.approveUser(account, testUser.id);

  //assert
  response.status.should.equal(200);
  let approvedUser = await db.User.findById(testUser.id);
  response.body.should.eql(JSON.parse(JSON.stringify(approvedUser)));
});
Note, that it.only will make mocha execute only this particular test.
In the arrange block we populate database with test records. Then, in the act block we call our API sending an HTTP request: POST localhost:3000/users/:userId/approve. And finally, in the assert block we check results. So obviously, we don’t mock any services here but just call our API hosted locally. To perform the HTTP call we use special client service – REST, which uses supertest under the hood. Another dependency here is dataHelpers service. This is our simple database client, used to pre-populate test data in every particular test.
In general, Intellij recognizes the test and you can also click icon  , however test will fail. The reason is that our test requires more dependencies now, and namely – config with actual API host and database connection settings, mocha hooks to create db connection before all tests and close it after all, custom assertions, etc. First of all, let’s see how can we execute integration tests outside of IDE. To do that, we’re going to create a script in our package.json:
"scripts": {
    "it:dev": "mocha ./server/test/integration/**/*.it.ts --opts ./server/test/mocha.it.opts
     --config=./server/test/.config/dev-debug.json || true",
}
As you can see, we’re executing mocha passing three parameters:
./server/test/integration/**/*.it.ts– path to the files that need to be executed by mocha--opts- path to the mocha options file--config- path to the config file (api host, database connection)
And here’s an example of how mocha.it.opts and dev-debug.json might look like:
--require ts-node/register
--require ./server/test/assertions
--reporter spec
--recursive
./server/test/integration/hooks.ts
--full-trace
--exit
--inline-diffs
--retries 3
{
  "api": {
    "host": "localhost:3000"
  },
  "mongo": {
    "address": "mongodb://localhost/your-database",
    "options": {
      "server": {
        "socketOptions": {
          "keepAlive": 1
        },
        "auto_reconnect": true,
        "reconnectInterval": 1000
      }
    }
  }
 }
}
Running npm run it-dev will execute all the tests successfully now. So, how can we pass all the needed params in IDE? Well, it’s quite simple: you can open “Run -> Edit Configurations…” in the main menu and add new Node.js configuration in there, just like this:
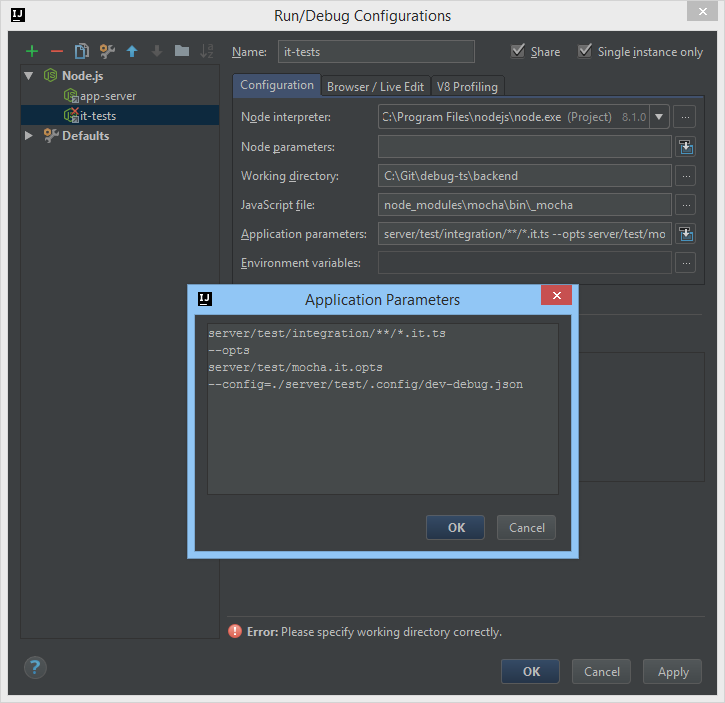 Node.js backend tests Run/Debug Configuration in Intellij
Great, so now you can select your configuration and execute/debug all tests at once. ![]()
Running App Debugging
Previous example showed how to debug integration tests, but unfortunately your breakpoint in the app controller won’t break execution. This is because we start our app outside of IDE, so Intellij has no clue about our running server. Therefore, to let it control our app execution we can simply create a new Run/Debug configuration to start our server. Consequently, our IDE will attach to Node.js backend process and debugger will work just like we want. Here’s how the configuration may look like:
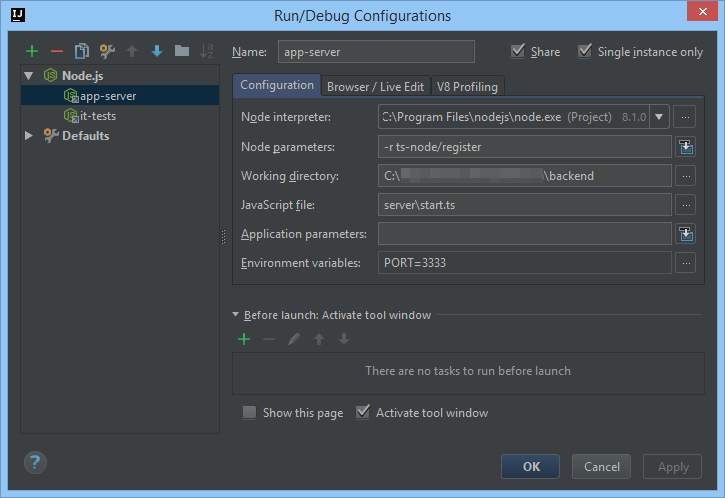 Node.js Backend Run/Debug Configuration Intellij
Voila, now we can set breakpoints in our controllers and whenever the code is executed IDE will stop on breakpoint and pass us control.
What Next
We hope this tutorial may help someone to understand the basics of how to setup IntelliJIdea for debugging Node.js backend apps. However, it’s pretty much the same if you’re using another IDE like VSCode/Atom. If you know any other ways to make debugging even better, just let us know. And for sure, don’t hesitate to share this post in social networks:)


